 I gave a guest lecture at Birkbeck College, of the University of London on the evening of 22nd February 2017 in the evening, as part of the Energy and Climate Change module. I titled it, “Renewable Gas for Energy Storage : Scaling up the ‘Gas Battery’ to balance Wind and Solar Power and provide Low Carbon Heat and Transport”.
The basic concept is that since wind and solar power are variable in output, there has to be some support from other energy technologies. Some talk of batteries to store electrical energy as a chemical potential, and when they talk of batteries they think of large Lithium ion piles, or flow batteries, or other forms of liquid electrolyte with cathodes and anodes. When I talk about batteries, I think of electrical energy stored in the form of a gas. This gas battery doesn’t need expensive metal cathodes or anodes, and it doesn’t need an acid liquid electrolyte to operate. Gas that is synthesised from excess solar or wind power can be a fuel that can be used in chemical reactions, such as combustion, or burning, to generate electricity and heat when desired at some point in the future. It could be burned in a gas turbine, a gas boiler or a fuel cell, or in a vehicle engine. Or instead, a chemically inert gas can be stored under pressure, and this compressed gas can also be used to generate power on demand at a later date by harnessing energy from decompression. Another option would be holding a chemically reactive gas under pressure, allowing two stages of energy recovery.
As expected, the Birkbeck audience was very diverse, and had different social and educational backgrounds, and so there was little that could be assumed as common knowledge, especially since the topic was energy, which is normally only an interest for engineers, or at a stretch, economists.
I decided when preparing that I would attempt to use symbolism as a tool to build a narrative in the presentation. A bold move, perhaps, but I found it created an emblematic thread that ran through the slides quite nicely, and helped me tell the story. I used Mathematical and Physical notation, but I didn’t do any Mathematics or Physics.
 I introduced the first concept : the Delta, or change. I explained this delta was not the same as a river delta, which gave me the excuse to show a fabulous night sky image of the Nile Delta taken from the International Space Station. I demonstrated the triangle shape that emerges from charting data that changes over time, and calculating its gradient, such as the temperature of the Earth’s surface.
 I explained that the change in temperature of the Earth’s surface over the recent decades is an important metric to consider, not just in terms of scale, but in terms of speed. I showed that this rate of change appears in all the independent data sets.
 I then went on to explain that the overall trend in the change in the temperature of the Earth’s surface is not the only phenomenon. Within regions, and within years and seasons, even between months and days, there are smaller scale changes that may not look like the overall delta. A lot of these changes give the appearance of cyclic phenomena, and they can have a periodicity of up to several decades, for example, “oscillations” in the oceans.
These discrete deltas and cycles could, to a casual observer, mask underlying trends, especially as the deltas can be larger than the trends; so climatologists look at a large set of measurements of all kinds, and have shown that some deltas are one way only, and are not cycling.
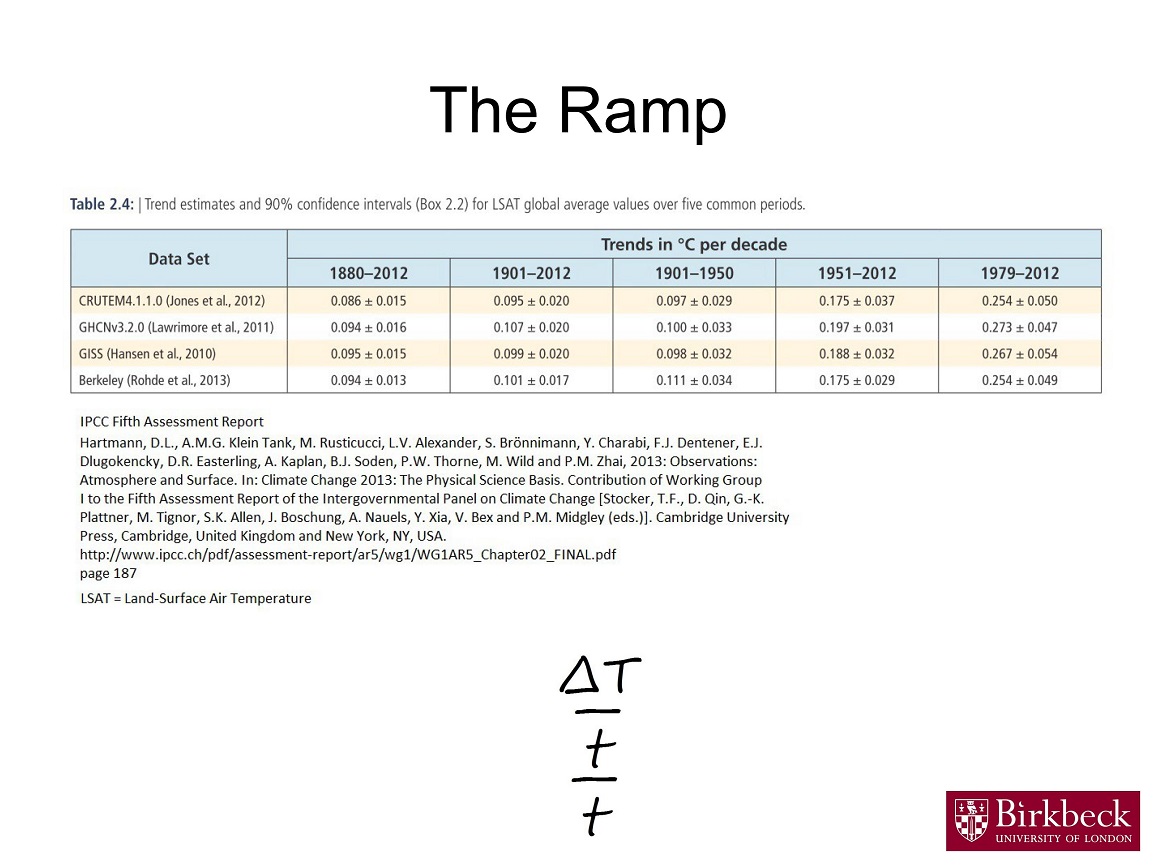 Teasing out the trends in all of the observations is a major enterprise that has been accomplished by thousands of scientists who have reported to the IPCC, the Intergovernmental Panel on Climate Change, part of the UNFCCC, the United Nations Framework Convention on Climate Change. The Fifth Assessment Report is the most comprehensive yet, and shows that global warming is almost certainly ramping up – in other words, global warming is getting faster, or accelerating.
 Many projections for the future of temperature changes at the Earth’s surface have been done, with the overall view that temperatures are likely to carry on rising for hundreds of years without an aggressive approach to curtail net greenhouse gas emissions to the atmosphere – principally carbon dioxide (CO2), methane (CH4) and nitrous oxide (N2O).
 From observations, it is clear that global warming causes climate change, and that the rate of temperature change is linked to the rate of climate change. In symbols, this reads : delta T for temperature over t for time leads to, or implies, a delta C for climate over t for time. The fact that global warming and its consequential climate change are able to continue worsening under the current emissions profile means that climate change is going to affect humanity for a long stretch. It also means that efforts to rein in emissions will also need to extend over time.
 I finished this first section of my presentation by showing a list of what I call “Solution Principles” :-
1. Delays embed and extend the problem, making it harder to solve. So don’t delay.
2. Solve the problem at least as fast as creating it.
3. For maximum efficiency, minimum cost, and maximum speed, re-deploy agents of the problem in its solution.
In other words, make use of the existing energy, transport, agriculture, construction and chemical industries in approaching answers to the imperative to address global warming and climate change.


